Why top?
Modern tools like htop, atop, and btop offer richer interfaces and friendlier visuals, so why does top still matter? Because top remains:
- lightweight — minimal overhead, fast startup
- reliable — stable, predictable behavior across distributions
- preinstalled — available on virtually every Unix-like system
In practice, people settle into a simple hierarchy:
btop— daily driver on desktops and laptopshtop— fallback on remote servers wherebtopisn’t installedtop— the universal fallback that works everywhere, from minimal containers to rescue environments
Start and Get Help
Running top launches the program and opens its live monitoring interface.
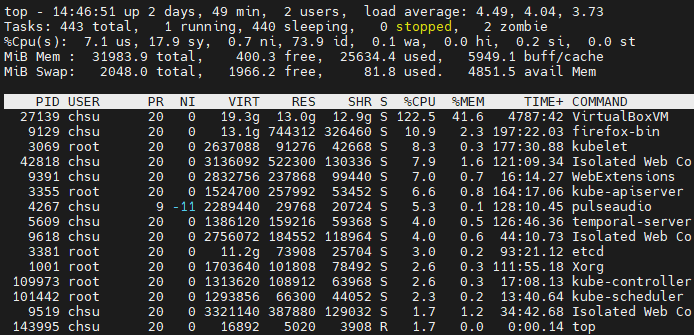
The screen is divided into two major sections:
- top section - system‑wide statistics (load, tasks, CPU, memory, swap)
- bottom section - the process list, updated in real time
Pressing h shows the built-in help screen.
Statistics Explained
Uptime & Load Average
top - 12:12:58 up 2 days, 22:15, 2 users, load average: 3.34, 3.44, 3.71
12:12:58- current system timeup 2 days- how long the system has been running2 users- number of logged-in usersload average: 3.34, 3.44, 3.71- average number of runnable + uninterruptible tasks over 1, 5, 15 minuts3.34- 1-minute load3.44- 5-minutes load3.71- 15-minutes load
Interpret load average
- On a 4‑core system, a load of 4.0 means full saturation.
- Compare short vs long windows:
- High 1‑min, low 15‑min → recent spike
- Both high → sustained pressure
Task Summary
Tasks: 445 total, 1 running, 442 sleeping, 0 stopped, 2 zombie
445 total- total number of processes1 running- actively using CPU442 sleeping- waiting for events0 stopped- paused viaSIGSTOPor debugging2 zombie- terminated but not yet reaped by their parent
Zombie Processes
A zombie is a dead process whose parent has not yet collected its exit status.
The kernel keeps a tiny entry in the process table so the parent can call wait() and retrieve:
- the child’s exit code
- some accounting information
When the parent dies first - If the parent dies before the child exits:
- The child is re-parented to PID 1 (
initorsystemd) - PID 1 always calls
wait()on orphaned children - The child is cleaned up immediately
- It does NOT become a zombie
When zombies appear
- Parent is alive but buggy - never calls wait().
- Parent is alive but stuck - blocked, deadlocked, or frozen.
- Parent is alive but overwhelmed - spawns children faster than it reaps
- Parent intentionally ignores children - poorly written daemons
When zombies disappera - A zombie disappears when its parent calls:
wait()waitpid()waitid()
Resource impact
- Zombies do NOT hold:
- memory
- file descriptors
- sockets
- CPU
- open files
- kernel objects
- All of above is released when the process exits
- Zombies do hold:
- a PID (too many zombies can exhaust the PID table)
- a tiny process table entry
- exit status
- minimal metadata
A few zombies are harmless; thousands can break the system.
CPU Usage
%Cpu(s): 7.9 us, 31.9 sy, 1.1 ni, 58.4 id, 0.4 wa, 0.0 hi, 0.3 si, 0.0 st
7.9 us— 7.9% time spent running user‑space processes31.9 sy— 31.9% time spent in the kernel, handling system calls1.1 ni— 1.1% time on user processes with positive nice values (lower priority)58.4 id— 58.4% time spent doing nothing, aka, idle time0.4 wa— 0.4% time on I/O wait (CPU stalled waiting for disk/network)0.0 hi— 0.0% time on hardware interrupts (network cards, disks, USB, etc.), zero means hardware is not interrupt-heavy0.3 si— 0.3% time on software interrupts (network stack, timers, kernel subsystems), low percentage is normal.0.0 st— 0.0% steal time (hypervisor taking CPU time from a VM, so VM related case only)
Steal time explanation ‘steal time’ is CPU time your VM wanted to use but the hypervisor did not give it (because the physical CPU was busy running other VMs or host tasks). Examples:
- Hypervisor oversubscription
- Cloud throttling (AWS T‑series, Azure B‑series, etc.) - When throttled, your VM sees
st > 0 - Multiple VMs competing for the same physical CPU
Key interpretations:
- High
us→ your programs are doing CPU-heavy work - High
sy→ kernel‑heavy workloads (I/O, networking, syscalls) - High
id→ CPU underutilized - High
wa→ storage or network bottleneck - High
st→ VM CPU contention or throttling
RAM & Swap
MiB Mem :  31983.9 total,    514.0 free,  25854.0 used,   5615.9 buff/cache
MiB Swap:   2048.0 total,   1843.5 free,    204.5 used.   4687.0 avail Mem
- Mem total — installed RAM
- Mem free — truly unused RAM
- Mem used — memory actively used by processes
- Mem buff/cache — kernel buffers + page cache
- Swap total — total swap space
- Swap free — unused swap
- Swap used — swap currently occupied
- avail Mem — memory available without swapping (most important metric)
Important notes:
- buff/cache is not wasted memory — Linux uses free RAM for caching and releases it when needed.
- avail Mem is the best indicator of real memory pressure.
- Non‑zero swap used is not automatically bad.
- What matters is active swapping (pages moving between RAM and Swap). To detect memory pressure:
- In
top, active swapping often shows as- rising
wa - low
avail Mem(e.g., < 200 MB)
- rising
- For direct measurement, use
vmstat 1, and checksi- swap-in pages per secondso- swap-out pages per second
- In
Usage
Set Refresh Interval
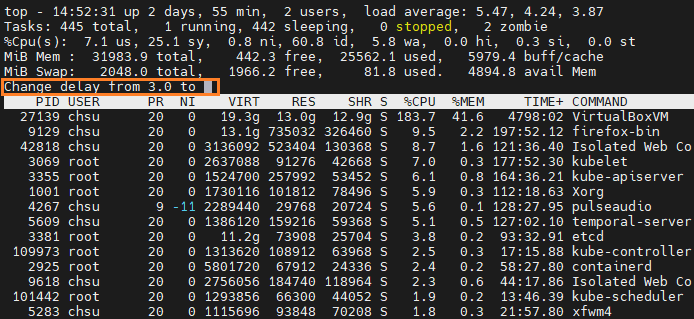
By default, top refreshes every 3 seconds. Press d or s to set a custom refresh interval.
Kill a Process
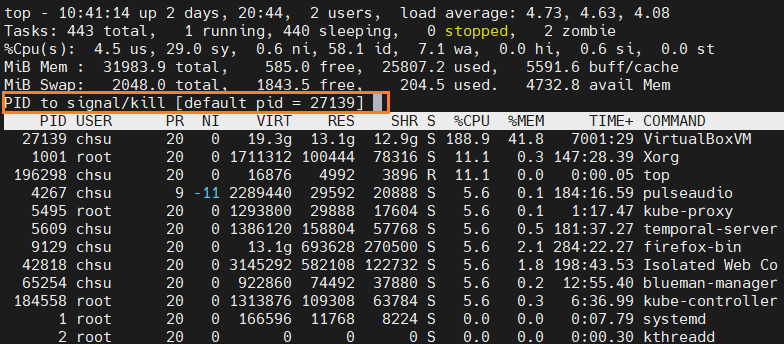
Press k and enter the PID when prompted to send a kill signal to a process.
Search Processes by Name
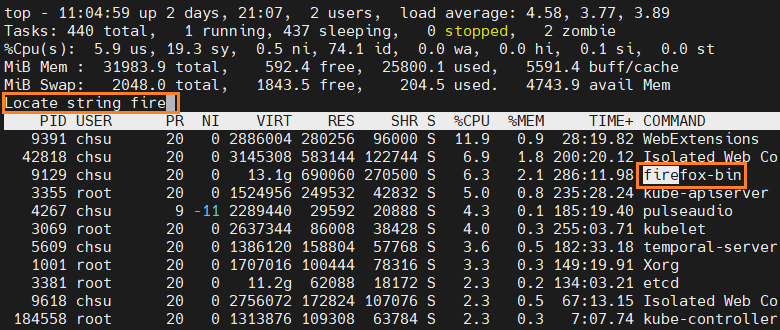
Press L (locate) and enter a keyword to highlight matching processes in the list.
Sort Process List
Press f to open Fields Management, then select a field and press s to sort by it.
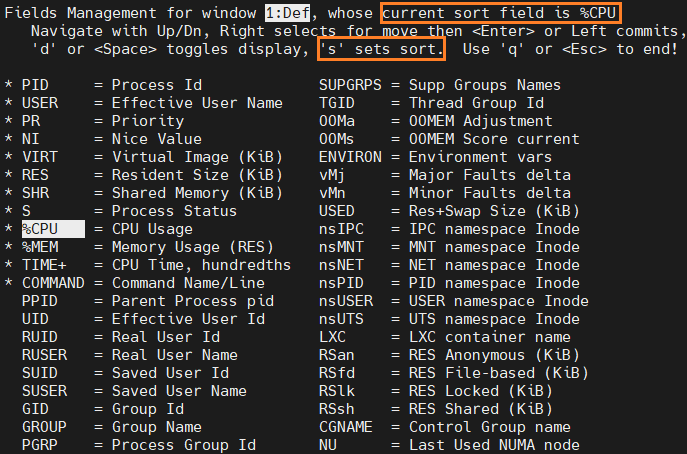
Press R to reverse the current sorting order.
Filter Process List
By User
Press u and enter a username to filter the process list by that user.
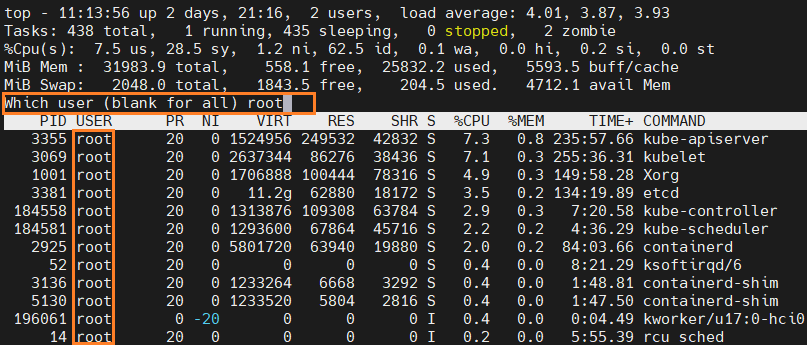
By Criteria
Press o and set the filter criteria. For example:
PID=271391- show only the process with PID 271391COMMAND=fire- show only processes whose name contains “fire”
UI Settings
Fields
Press f to open Fields Management, where you can choose which columns appear in the process list.
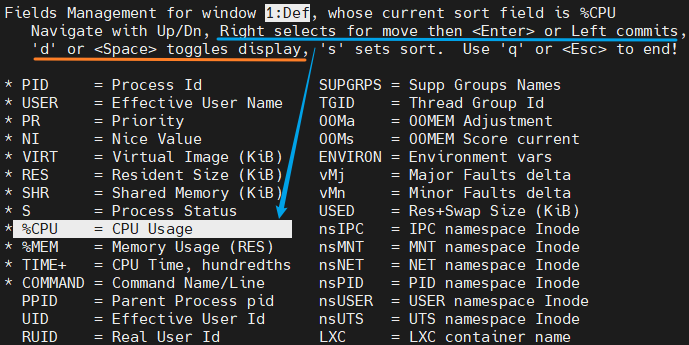
Notes:
- Use the right arrow key to select a field and enable movement.
- Press
qto save and quit (not discard and quit).
Number of Processes to Display
Press n and enter a number to controll how many processes appear in the bottom process list.
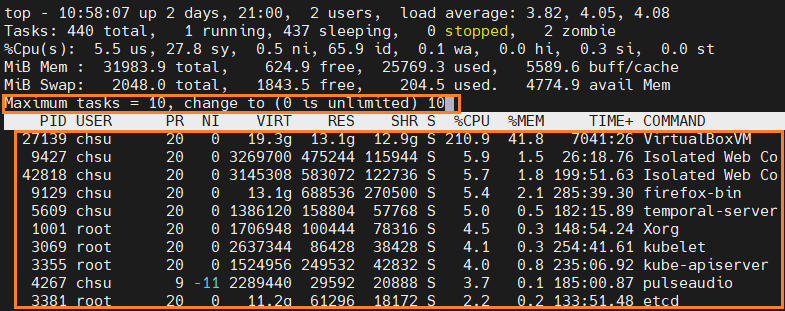
CPU Views
Press t to cycle through different CPU views:
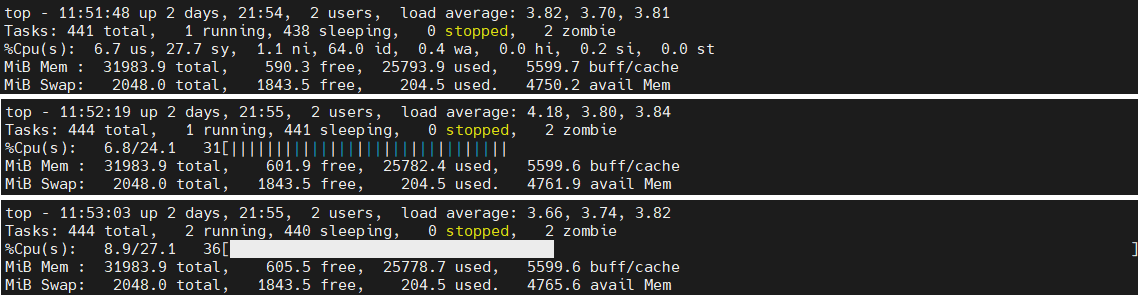
In addition, keys 0 - 4 toggle five CPU display modes. For example, pressing 4 switch to the two abreast layout:

Memory Views
Press m to cycle through memory summary views, similar to how t cycles CPU views.
Appearance
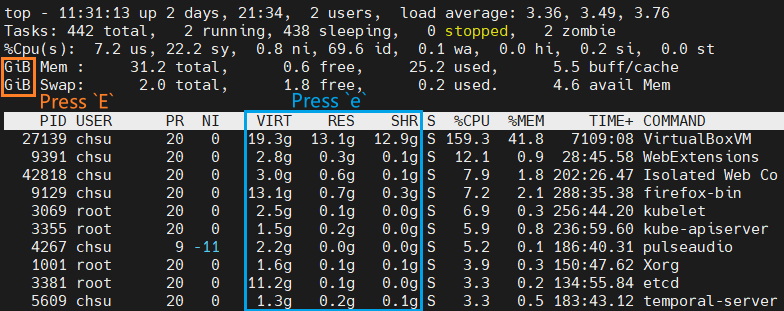
Press
E- change the memory scale in the summary sectione- change the memory scale in the task list
Press Z to open Color Mapping, where you can customize colors for different UI regions.
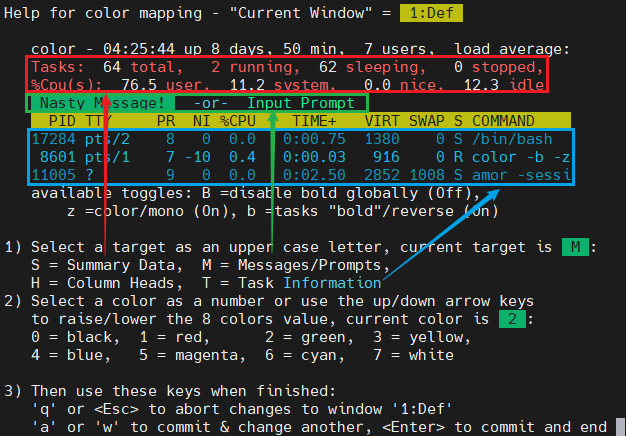
Each target (S, M, H, T) corresponds to a different part of the interface, and you can assign colors to each independently.
Common Pitfalls & Tips
Misreading Load Average
Load average measures runnable + uninterruptible tasks, not CPU usage.
- Load - number of tasks wanting CPU.
- For servers,
Load ~ 0.7 * core countis a good situation, because it provides- enough headroom for bursts
- lower latency
- more predictable performance
- For batch workload (e.g., video encoding, scientific computing), you may want to maximum throught and expect CPU to be fully used, so
Load = core count
- For servers,
- Core count - number of tasks that can run simultaneously.
- A load of 4.0 on a 4‑core system means full saturation; a load of 4.0 on a 1‑core system means overload.
“Free” vs “Available” Memory
free memory is often close to zero on Linux — this is normal. Linux aggressively uses RAM for caching. The real indicator of memory pressure is available memory (avail Mem).
Swap Usage
Swap usage alone is harmless. What matters is active swapping, which you detect via vmstat (si/so) or rising wa in top.
Misunderstanding Zombie Processes
Zombies do not consume memory or CPU. They only occupy a PID and a tiny process table entry. A few zombies are fine; thousands indicate a parent process failing to reap children.
Overlooking sy Time
High sy means the kernel is busy — often due to I/O, networking, or heavy syscall workloads. If sy is consistently high, the bottleneck is usually not CPU but kernel activity.
Ignoring I/O Wait
High wa means the CPU is stalled waiting for disk or network. This is a strong signal of storage bottlenecks or slow filesystems.
Misinterpreting Steal Time
st only matters inside VMs. Non‑zero st means the hypervisor is taking CPU time away from your VM — common on oversubscribed or burstable cloud instances.
Not Using Filters and Sorting
top becomes dramatically more useful when you:
- filter by user (u)
- locate processes (L)
- sort by CPU, memory, or time (f + s)